White Paper - "Trading Seasonality" - Seasonality Zonestm
Introduction
What Is Seasonality?
The Yearly Seasonal Cycle
Seasonality Zonestm
Seasonal Heat
Seasonality And Other Instruments
Deploying Seasonality As Part Of An Overall Strategy
Conclusion
Since we are putting our computer to work, let's have it highlight those 14-day (or longer) periods in the seasonal cycle that are strongest zones and also highlight those 14-day (or longer) periods in the seasonal cycle that are the weakest zones.
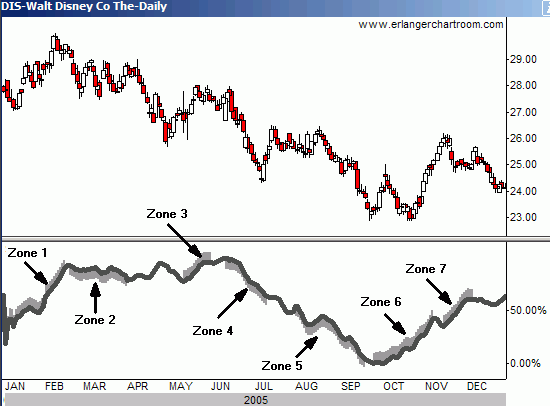
Figure 5 Disney (DIS) seasonal cycle with seasonality zones
These zones are plotted in Figure 5 for Disney (DIS). In this chart, the seasonal cycle uses a 14-year sample from 1991 to 2004. This particular cycle was created on January 1, 2005 and was not changed in any way as 2005 actually transpired. In other words, the seasonal cycle you see below Disney's 2005 price action was created using data prior to 2005, and it was up to the price of Disney to follow it or not to follow it. The computer program has added shading to highlight the seasonality zonestm. Shadings on top of the seasonal cycle represent the strongest seasonal periods of 14-days or longer. Shadings below the seasonal cycle represent the weakest seasonal periods of 14-days or longer. Note how the price of Disney moved during 2005 relative to these zones.
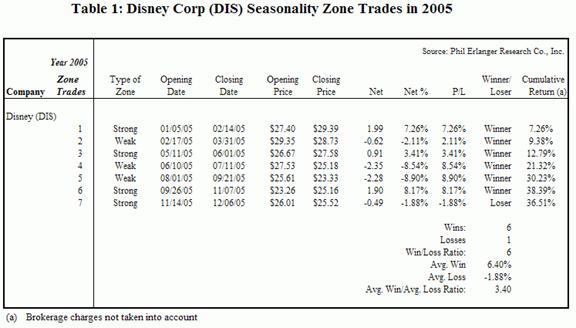
Table 1 contains the data for all the seasonality zones for Disney in 2005. There were 7 zones in 2005, four strong zones and 3 weak zones. Remember that these zones were identified with data ending in 2004. The price action of Disney in 2005 remarkably followed the paths of these zones in 6 out of the 7 instances. Not including commissions, the cumulative return in Disney's stock price during these zones was 36.51%. For 2005 as a whole, Disney's stock price fell 3.83 points, or -13.78%. For Disney in 2005, trading the seasonality zonestm outperformed a buy and hold strategy by 50.29% (36.51% - (-13.78%).)