White Paper - "Trading Seasonality" - Deploying Seasonality
Introduction
What Is Seasonality?
The Yearly Seasonal Cycle
Seasonality Zonestm
Seasonal Heat
Seasonality And Other Instruments
Deploying Seasonality As Part Of An Overall Strategy
Conclusion
Seasonality is a powerful technique that portfolio managers should employ. However, no one factor should dictate strategy. A sound strategy uses setup indicators and trigger indicators, and follows up with a reliable monitoring mechanism to aid in exiting trades. Seasonality is primarily a setup mechanism. Other setup mechanisms include (but certainly are not confined to) measures of sentiment. For instance, the observation of short sellers can uncover moments in time when either the bulls or the bears are particularly at risk from contrary move - hence the setup. Let's return to our example of Amgen to illustrate the point.

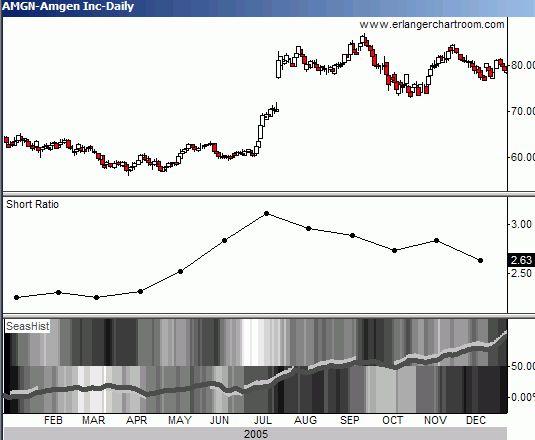
Figure 11 Amgen (AMGN) with short ratio and seasonal patterns
Figure 11 highlights two factors that show Amgen may be set up for a 3 rd Quarter buying opportunity. The seasonal curve turns up on June 24, initiating a positive seasonal zonetm. Seasonal heattm is also very positive. In addition, the short interest ratio has swelled significantly during 2005 heading into this positive seasonal period. Clearly these short sellers are either unaware of or are ignoring, the seasonal tendencies of Amgen. In a matter of days from the strong seasonal zonetm that started on June 24, 2005, Amgen took off, activating any short-term trigger indicators one might employ. The ensuing "short squeeze" included a huge gap to the upside and peaked 87 days later on September 19, 2005, just days after the completion of the second strong seasonal zonetm. This action handed the bulls a 40.53% gain.
Of course it is wonderful when the market follows those factors we employ. The market, however, is not so easily tamed. Its non-linear nature assures us of many moments when unforeseen factors rise up and bite us in tender places. Ironically, one of the most valuable observations that can be made of set up indicators is to recognize when they fail to work. Such moments indicate an unforeseen factor is in play - a factor that is more meaningful to the marketplace. When indicators fail, it means another game's afoot; this is a clue to the portfolio manager that adjustments are needed. At the very least a failed indicator should taint the manager's bias (either long or short.)

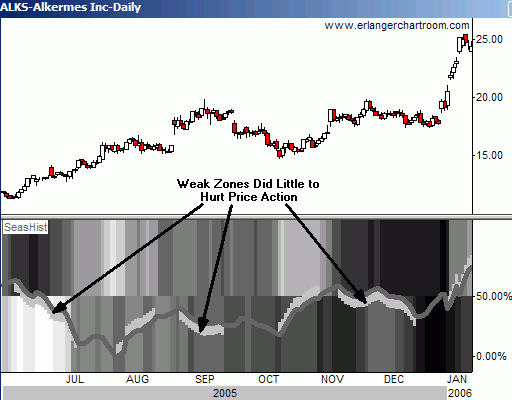
Figure 12 Alkermes (ALKS) with its seasonal patterns
Consider the seasonal pattern of Alkermes in Figure 12. The June weak seasonal zonetm is accompanied with blazingly negative heat. Nevertheless, price action rallied during this period. (Incidentally, trigger indicators would have kept traders from shorting here, because price action was so positive.) Clearly something else is biasing the action in Alkermes price - a clue for portfolio managers to be biased to the long side. As it turned out, Alkermes was in the midst of a long-term uptrend peppered with only the briefest and most moderate of pullbacks. All three weak seasonal zonestm in Figure 12 did little to hurt price action. These failures were clues to expect more than average performances of the strong seasonal zonestm.

